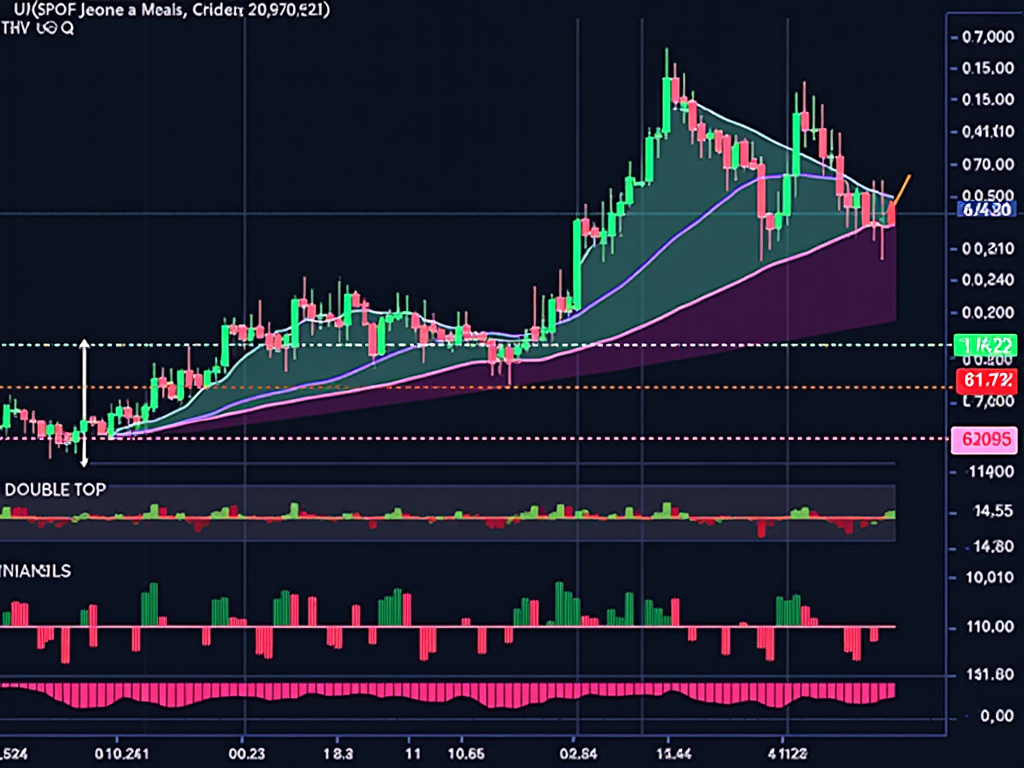
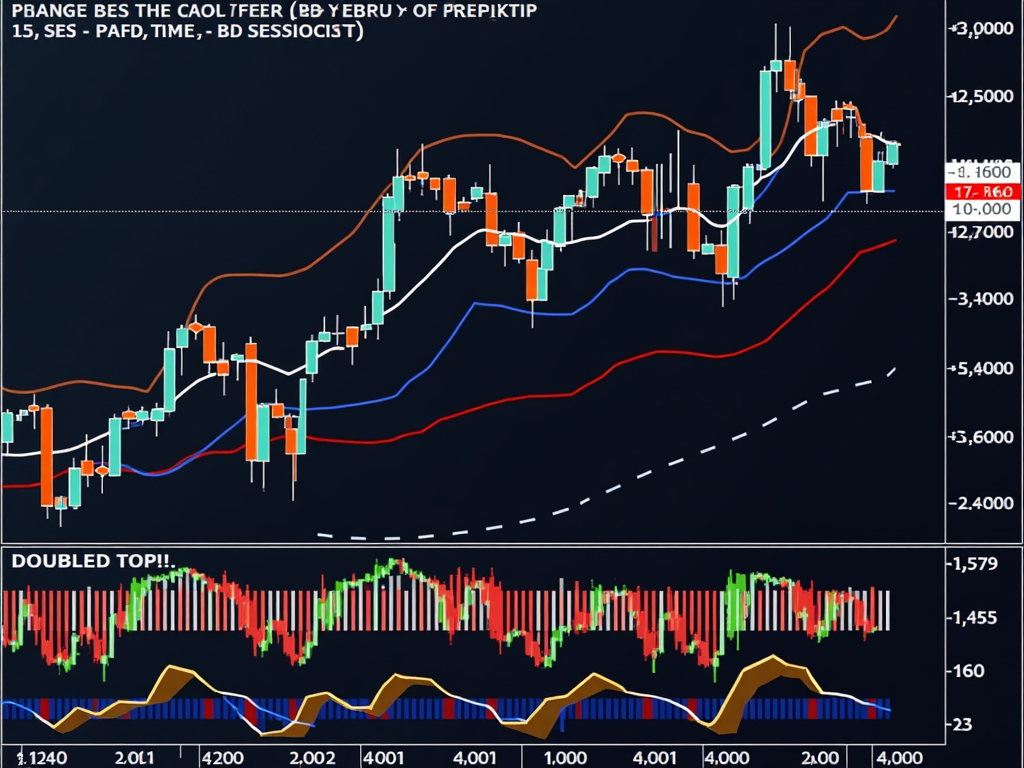
The art of technical analysis is a powerful tool in the arsenal of every investor. By understanding chart patterns and indicators, investors can better assess market trends and make informed decisions. This knowledge is crucial for deciphering the language of the markets and managing risks, as well as for seizing opportunities. In the following chapters, we will explore the basics of chart patterns and technical indicators and demonstrate how they can work together to enhance trading strategies.
The Art of Decoding: Understanding Chart Patterns in Technical Analysis

The study of chart patterns is an art form within technical analysis that can give traders an almost magical glimpse into the future of market movements. These patterns are not merely lines on a chart; they are the result of millions of trading decisions made over weeks, months, and even years. The key to effectively using these patterns lies in understanding the underlying psychological and technical market factors that shape them.
Trend reversal patterns like the head and shoulders formation are great examples of the psychological peak of a market. This formation develops after a strong upward movement and symbolizes significant market uncertainty, as traders try to evaluate the future direction. When the market declines after the second shoulder and breaks the so-called ‘neckline,’ this is often a strong signal that the trend is genuinely reversing.
Similarly, significant continuation patterns like flags and pennants appear after strong price movements. These patterns often signal that the market is merely taking a brief pause before continuing the existing trend. Such patterns can help traders navigate through the gentle curves and sharp points of market movements.
The complexity of such analyses is also evident in more complex formations like the cup and handle pattern, which can represent market resilience and the willingness to recover. When these patterns coincide with a significant increase in trading volume, it can greatly strengthen the relevance of the signal.
However, confidence in these patterns should never be blind. Traders must always consider the possibility of false alarms or “false breakouts” and thus should always implement risk management measures, such as setting stop-loss orders. An integrated strategy combining chart patterns with technical indicators offers a much stronger foundation for informed trading decisions.
Ultimately, mastering chart patterns requires both experience and continuous learning. It is a dynamic skill that requires constant refinement and is enhanced through application in real-life scenarios. Traders who dedicate themselves to continuous practice and education are better equipped to successfully face the challenges of the market.
Technical Indicators: Understanding the Invisible Signals

The world of technical analysis is rich with tools that can assist traders in predicting market movements. Among the most decisive tools are technical indicators. These mathematical calculations provide valuable insights into future trends, support and resistance levels, and potential buy or sell signals, based on historical price and volume data. One of the most fundamental and versatile indicators is the moving average. It helps to smooth out the “noise” of price movements, offering a clear view of long-term trends. There is a distinction between the simple moving average (SMA) and the exponential moving average (EMA), with the latter reacting more promptly to price changes.
Another popular indicator is the Relative Strength Index (RSI), which measures momentum and the speed of price changes. With a scale from 0 to 100, it indicates whether a security is overbought (values above 70) or oversold (values below 30), which can signal crucial turning points on the chart.
The Moving Average Convergence Divergence (MACD), on the other hand, is one of the trend-following indicators. By measuring the relationship between two moving averages, the MACD reveals both the strength and weakness of a trend. A well-known trading signal is generated when the MACD line crosses the signal line, often heralding a forthcoming trend reversal.
The use of Bollinger Bands excellently integrates these techniques. They capture volatility and help determine if prices are overbought or oversold, moving within two standard deviations around a central moving average. It is also worth highlighting the stochastic oscillator, which measures the relative position of the closing price within a price range and can serve as an additional indication of potential trend reversals.
Although focusing on a single indicator may seem appealing, the full potential is revealed in the expert combination of multiple indicators. For example, combining the RSI with Bollinger Bands can confirm the strength of potential trend reversal signals. However, this variety always requires a critical application, integrated with historical data testing to ensure reliable forecasts and thus assure the success of sustainable investments.